
🗳️Denver’s June Primary Election🗳️
By Trish Hyde
How accurately can we predict election results based on door-to-door canvassing?
From May 29th-June 30th, 2026, the Open Answer team knocked over 42,000 doors between State House District 6 and State Senate District 34. While on the doors, our team worked to identify where voters stood on both candidates in each district and persuade voters toward our candidates.
Candidate support is categorized as follows:
Lean Support for Candidate A
Strong Support for Candidate A
Undecided
Lean Oppose for Candidate A
Strong Oppose for Candidate A
No Response
Refused
What we found, and what has historically been the case as well, is that voters are uncomfortable with sharing that they’re planning to vote for Candidate B when asked by a canvasser who is there to persuade them to vote for Candidate A. This means the “Lean Oppose” and “Strong Oppose” numbers are often significantly lower than actual voter data turns out to be. What we find, instead, is that most of the “Lean Oppose” and “Strong Oppose” responses actually live in the “No Response” and “Refused” categories. Assuming all “No Response” and “Refused” voters decided to vote for the other candidate, and if split the “Undecided” group evenly between both candidates, we found our data to closely predict the outcome of each election.
State Senate District 34
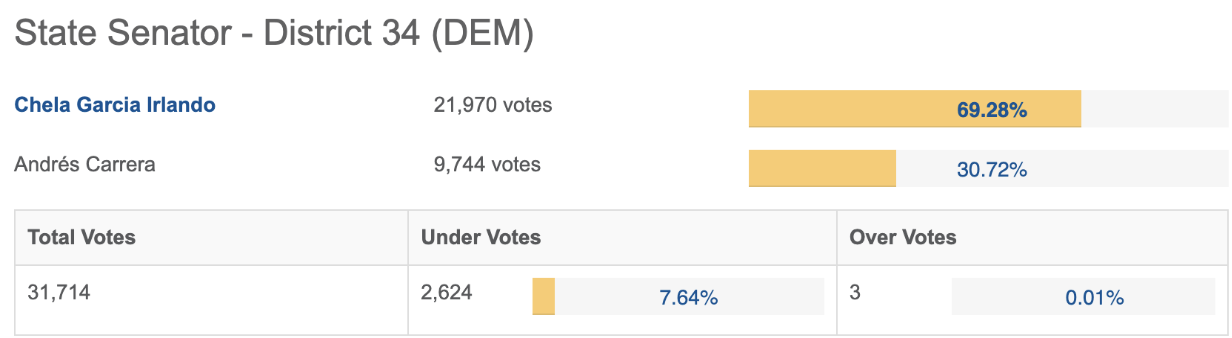
Based on the number of completed voter contacts, the estimated sampling error is approximately ±1.3% at the 95% confidence level. The difference between our data and the election results fell within the margin of error.
Our Data
Chela Garcia Irlando (Lean Support + Strong Support + ½ Undecided)
68.10%
Andres Carrera (Lean Oppose + Strong Oppose + No Response + Refused + ½ Undecided)
31.46%
Actual Election Results
State House District 6
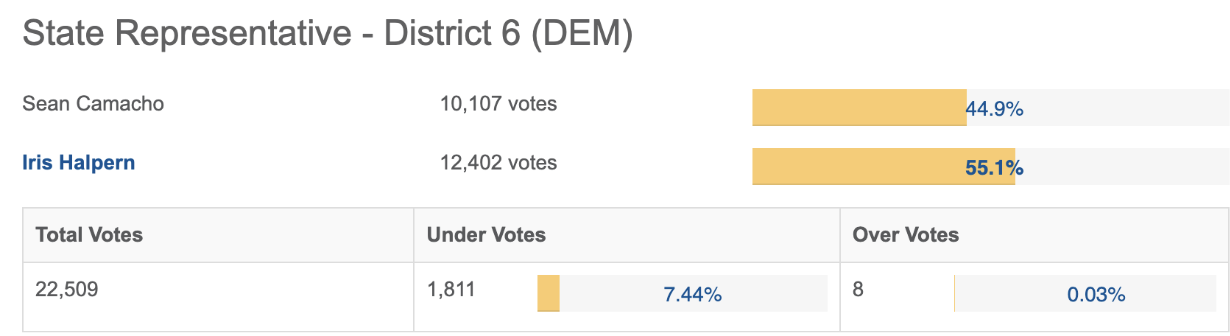
Based on the number of completed voter contacts, the estimated sampling error is approximately ±1.8% at the 95% confidence level. The difference between our data and the election results fell slightly outside of this margin of error but by less than 3%.
Our Data
Iris Halpern (Lean Support + Strong Support + ½ Undecided)
59.64%
Sean Camacho (Lean Oppose + Strong Oppose + No Response + Refused + ½ Undecided)
40.36%
Actual Election Results
The Open Answer Difference
For this primary election, we were speaking almost exclusively to higher propensity voters which means our data was more accurate than it would have been had we been speaking to lower propensity or newer voters. However, not all data is collected equally and the accuracy of this data is owing in large part to Open Answer’s internal policies and procedures. At Open Answer we hold ourselves to a high standard of performance and we pride ourselves on collecting the most accurate data for our partners. It is this north star that guides our hiring, labor practices, and rigorous quality control policies.